Optimizing Materialized Views Part IV: Introduction to HOLAP Cubes
A Quick Recap
In part II of this series I described the mechanism by which the direct path enhancement to materialized view fast refresh, and the benefits it bestows.
In part III I showed how we can identify circumstances in which we can entirely bypass Oracle's internal mechanism for fast refresh and instead use our own insert statement to maintain the materialized view. Tricky stuff, and not entirely conventional, but powerful nonetheless.
In this part IV we return to the straight and narrow of accepted practice, albeit somewhat at the cutting edge, by looking at a type of materialized view. More accurately we will look at a type of query which we can materialize in an MV and which specifically addresses the subject of multiple MV refreshes.
Hierarchical OLAP Cubes
One of the items of work that is carried out in the refresh of a materialized view is the scan of the changed data in the master table. When you are refreshing multiple materialized views based directly on the same fact table then that change data gets scanned multiple times. We might spend time looking at how we can reduce the work of these multiple scans, but how much more satisfactory it is to find a way of eliminating all but one of the scans entirely. We will do this by taking advantage of the ability of Oracle to aggregate to multiple levels in a single SQL statement.
You'll find this documented in various places under the subject of Hierarchical Cubes, most usefully in the Data Warehousing Guide, and the principle is fairly simple. In just the same way as a regular materialized view holds a single level of aggregation (for example at the level of "location code" and "transaction month") a hierarchical cube can hold a number of different aggregation levels in a single materialized view. Don't be misled or intimidated by the the word “cube” by the way. Other than a simple change in the syntax of the MV query and an additional concept or two there is nothing here that is much of a paradigm shift for us humble databasers.
So, a hierarchical cube hold multiple aggregation levels in a single table. We have been using as an example a fact table with a logical structure as follows:
create table master
 (
 location_cd  number not null,
 tx_timestamp date   not null,
 product_cd   number not null,
 tx_qty       number not null,
 tx_cst       number not null
 )
/
Based on such a table we have a great many choices of aggregation level that we might find use for. In general we might expect to use the following:
location_cd and trunc(tx_timestamp,'D')
product_cd and trunc(tx_timestamp,'D')
trunc(tx_timestamp,'D')
trunc(tx_timestamp,'MM')
location_cd and product_cd and trunc(tx_timestamp,'D')
location_cd and product_cd and tx_timestamp (if not unique in the master table, and even then see “The Mysterious Benefit Of Completely Redundant Materialized Views”)
Many of these materialized views are going to be very small, and it seems like a shame to be scanning many millions of new rows multiple times on their account. Maybe we might modify our strategy to base some of the higher level MV's on other lower level MV's, and that's an option that we'll look at later on, but for now let us see what an hierarchical cube can do for us.
Syntax
There are a number of slightly different syntaxes through which multilevel aggregation can be enabled, but the one that I prefer myself is the "Grouping Sets" method. This is because it gives me exact control over which aggregation levels I want to be "materialized" with the minimum of brainwork.
For example, consider the following syntax:
Select
   product_cd,
   location_cd,
   trunc(tx_timestamp,'MM') tx_month,
   sum(tx_qty) s_tx_qty,
   sum(tx_cst) s_tx_cst,
   count(*)    c_star
from
   master
group by
   grouping sets
      ((trunc(tx_timestamp,'MM'),product_cd ),
       (trunc(tx_timestamp,'MM'),location_cd));
Those last three lines are what makes this SQL “special”, by producing multiple levels of aggregation from a single SQL statement. In this case we have a single statement generating the aggregations at the month/product level and the month/location level.
Once you have grasped this it is of course easy to extend the syntax to more levels, and here is an example with six of them:
Select
   product_cd,
   location_cd,
   trunc(tx_timestamp,'MM') tx_month,
   sum(tx_qty) s_tx_qty,
   sum(tx_cst) s_tx_cst,
   count(*)    c_star
from
   master
group by
   grouping sets
      ((trunc(tx_timestamp,'MM'),product_cd),
       (trunc(tx_timestamp,'MM'),location_cd),
       (trunc(tx_timestamp,'MM')),
       (product_cd,location_cd),
       (product_cd),
       (location_cd));
Naturally when we compute multiple aggregation levels in a single query result we need a reliable method of distinguishing between the aggregation levels. We cannot just select a Sum() of a metric column of a cube like this without inflating the required result by some integer factor (six, in this last example), and it follows that every single query that gets rewritten against such a multilevel aggregation needs to select the rows of only a single aggregation level, and exclude all others.
To enable this we use a "Grouping" function, and the most convenient form for our purposes is GROUPING_ID. This identifies in a single value the aggregation (or “grouping” if you wish) level of a row by returning a bit vector of ... well just read about it here. But long-story-short, if you are going to define a materialized view with multiple aggregation levels then you include the GROUPING_ID function based on all the dimensions included as grouping levels. Thus we would write:
Select
   grouping_id
    (trunc(tx_timestamp,'MM'),
     product_cd,
     location_cd) gid,
   product_cd,
   location_cd,
   trunc(tx_timestamp,'MM') tx_month,
   sum(tx_qty) s_tx_qty,
   sum(tx_cst) s_tx_cst,
   count(*)    c_star
from
   master
group by
   grouping sets
   ((trunc(tx_timestamp,'MM'),product_cd),
    (trunc(tx_timestamp,'MM'),location_cd));
or:
select
   grouping_id
    (trunc(tx_timestamp,'MM'),
     product_cd,
     location_cd) gid,
   product_cd,
   location_cd,
   trunc(tx_timestamp,'MM') tx_month,
   sum(tx_qty) s_tx_qty,
   sum(tx_cst) s_tx_cst,
   count(*)    c_star
from
   master
group by
   grouping sets
      ((trunc(tx_timestamp,'MM'),product_cd),
       (trunc(tx_timestamp,'MM'),location_cd),
       (product_cd,location_cd),
       (trunc(tx_timestamp,'MM')),
       (product_cd),
       (location_cd));
Notice that we just include each dimension column once there, irrespective of how many times it is included in different grouping sets.
This seems like an appropriate time to look at the execution of such queries:
drop table master
/

create table master
   (
   location_cd  not null,
   tx_timestamp not null,
   product_cd   not null,
   tx_qty       not null,
   tx_cst       not null
   )
pctfree 0
nologging
as
select
   trunc(dbms_random.value(1,10)),
   to_date('01-jan-2005','DD-Mon-YYYY')
      + dbms_random.value(0,30),
   trunc(dbms_random.value(1,10000)),
   trunc(dbms_random.value(1,10)),
   trunc(dbms_random.value(1,100),2)
from
   dual
connect by
   1=1 and
   level < 1000001;

begin
   dbms_stats.gather_table_stats
     (ownname    => user,
      tabname    => 'MASTER',
      method_opt => 'for all columns size 254');
end;
/

SQL> select * from table(dbms_xplan.display());

PLAN_TABLE_OUTPUT
--------------------------------------------------------------------------------

Plan hash value: 4085247581

----------------------------------------------------------------------------------------------------------
| Id  | Operation                  | Name                        | Rows  | Bytes | Cost (%CPU)| Time     |
----------------------------------------------------------------------------------------------------------
|   0 | SELECT STATEMENT           |                             |  1000K|    82M|   667   (2)| 00:00:08 |
|   1 |  TEMP TABLE TRANSFORMATION |                             |       |       |            |          |
|   2 |   LOAD AS SELECT           |                             |       |       |            |          |
|   3 |    TABLE ACCESS FULL       | MASTER                      |  1000K|    20M|   659   (2)| 00:00:08 |
|   4 |   LOAD AS SELECT           |                             |       |       |            |          |
|   5 |    SORT GROUP BY           |                             |     1 |    48 |     3  (34)| 00:00:01 |
|   6 |     TABLE ACCESS FULL      | SYS_TEMP_0FD9D6607_12037633 |     1 |    48 |     2   (0)| 00:00:01 |
|   7 |   LOAD AS SELECT           |                             |       |       |            |          |
|   8 |    SORT GROUP BY           |                             |     1 |    48 |     3  (34)| 00:00:01 |
|   9 |     TABLE ACCESS FULL      | SYS_TEMP_0FD9D6607_12037633 |     1 |    48 |     2   (0)| 00:00:01 |
|  10 |   VIEW                     |                             |     1 |    87 |     2   (0)| 00:00:01 |
|  11 |    TABLE ACCESS FULL       | SYS_TEMP_0FD9D6608_12037633 |     1 |    87 |     2   (0)| 00:00:01 |
----------------------------------------------------------------------------------------------------------
Isn't that interesting? It's pretty esoteric stuff, although later on we'll see some real eye-bulgers. There is some kind of temporary structure being used there, but what is its nature? To answer questions of this sort we can run a SQL trace on the query, but I'm going to leave the results of that for another posting because otherwise I'm going to set another new record for length of blog entry. However it is clear that some internal temporary structures are being created to help with the aggregation, so some optimizations are at work here that we will explore in detail another time. For now let us look at some performance comparisions.
There are three types of comparison of interest here.
Firstly, how is the performance of a HOLAP query affected by the addition and nature of further aggregation levels? My instinct going into this exercise is that there is a certain overhead involved in using a HOLAP query, based on the existence of all those temporary structures that need to be created. Also I suspect that there could be optimizations that allow lower levels of aggregation to be leveraged in the calculations of higher levels – for example it could be that an aggregation to the (product_cd,location_cd) level can be used as an intermediate result in calculating an aggregation at the (product_cd) and the (location_cd) levels. It could also be that such optimizations are highly dependent on Oracle version.
Secondly, how does the performance of a HOLAP query compare with running multiple single-level aggregations?
Thirdly, how do the different forms of syntax – RollUp(), Grouping Sets() and Cube() -- compare performance-wise? Again, this may be very version dependent, and if the optimizations are in place we can expect there to actually be little difference.
Fourthly, how is all this affected by the new hash-based grouping algorithm of version 10gR2? Without the need for a SORT GROUP BY operation it seems that this might make a real difference to the internal optimizations of the aggregations.
HOLAP Performance With Different Aggregation Levels
First a hypothesis, or maybe just speculation.
A HOLAP query potentially contains enough information for the optimizer to tell that there are result sets generated that can then be leveraged to produce further result sets. For example if you are going to aggregate at 10,000,000 row table and generate a 1,000,000 row result set for the grouping (col1, col2) then if the 1,000 row groupings (col1) and (col2) are also required then it makes sense to use the (col1, col2) result set to do so. On the other hand if two result sets (col1, col2) and (col2, col3) are required then there might be an advantage in calculating (col1, col2, col3) as an intermediate step, but it would depend on the sophistication of the optimization and the determination of whether such an intermediate step was worthwhile. If no intermediate set is produced then the original set of rows would be scanned twice, and as long as we can keep our sorts in memory we ought to be able to detect this.
When thinking about the possibilities for aggregation it makes sense to think of a tree structure of potential intermediate result sets, such as the following
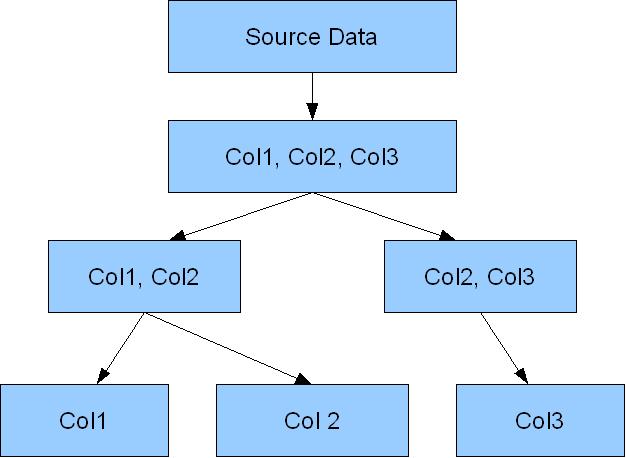
That one shows promise for optimization by leveraging the intermediate result sets. However the following one does not:

I'm going to construct a slightly different test data set for this experiment, involving the aggregation of 10,000,000 by three different columns each having around 1000 distinct values. We will try aggregations at a number of different levels and combinations of levels, such as: ((COL1)), ((COL1),(COL2)), ((COL1),(COL1,COL2)), ((col1),(col2),(col3),(col1,col2,col3)), etc. with the intent of exposing us to almost a full range of potential optimizations.
The methodology for these tests is to execute each query four times, flushing the buffer cache before each one. The average statistics of the last three executions will be taken (with the intent that the recursive calls due to the hard parse of the first execution are thus excluded). Workarea size policy will be set to manual and sufficient sort area allocated to eliminate disk sorts. The host machine and database will be as quiescent as possible, which is not difficult to achieve in this environment.
.... And with that I'm going to break off this entry to let you absorb these ideas, comment back if you wish, and give me time to complete the tests.
posted by David Aldridge @ 11:01 PM
![]()
![]()


3 Comments:
Hey David: you're gonna put all this into a series of pdfs or a book of some sort, aren't you?
Because if you don't, then we better start saving all this precious info somewhere!
Thanks for putting your mind into this, bloody darn useful stuff.
Ah, funny you should mention that ... who is it that doesn't like pdf's? Is it Howard? I remember someone damning them roundly. Maybe it was Joel Spolsky. Buh ... can't remember.
Yes, actually the more I write about this the less coherent it sounds to me, so a side project is to wrap it all up in a pdf (sorry, whoever-you-are) and find somewhere to make it available. Maybe OTN would be interested.
But anyway I'm going to have to get further into this before I commit to too much work on a wrap-up doc, 'cos the whole thrust of the series has already changed once ... who knows how often it will change in the future?
thanks Noons
You haven't mentioned the cherry on top: partition a Mview (query rewrite) by its grouping_id! Say you gotta fact table with 2 dimensions and 2 levels, you'd just go
GROUP BY ((Dim1L1), (Dim2L2)), ((Dim2L1), (Dim2L2)) ROLLUP
And if you'd probably want to get paritions:
grp_id 0
grp_id 1, 3
grp_id 2, 4
...
This is probably the most efficient way to build ROLAP cubes, both in terms of development time and performance time. With additional subpartioning you're really getting into the performance waters of MOLAP.
Post a Comment
<< Home